
Case study · Our product
A profitability and compliance command centre for a trucking fleet
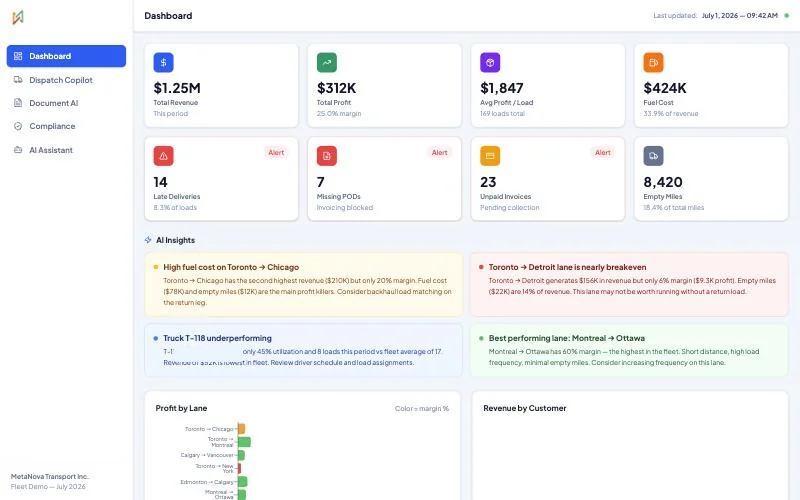
A command centre that turns a fleet's loads, lanes and documents into a single profitability and compliance picture: which lanes and trucks are actually making money, which loads are at risk today, and which drivers or vehicles need attention this week.
At a glance
The project in brief
- Business: a cross-border trucking fleet moving freight for retail and logistics customers
- What we built: a profitability dashboard, a live dispatch board, a document extraction tool and a compliance tracker, with a natural-language assistant over all of it
- Scope: lane and customer profitability, load risk flagging, document data extraction, driver and vehicle compliance
- Team: MetaNova AI delivery and engineering from Hyderabad
The challenge
The numbers existed, just never in the same place
A trucking fleet's numbers live in three different places that rarely get compared. Dispatch knows which loads are moving. Accounting knows what came in and what it cost. Safety knows which drivers and trucks are in or out of compliance. None of them naturally sees what the other two know, so a lane can run for months while quietly losing money, and nobody notices until someone adds it up.
Paperwork made it worse. Rate confirmations, bills of lading, proofs of delivery and invoices arrived as scanned documents that had to be read and typed in by hand before anything downstream could use them, and a missing proof of delivery could block an invoice for weeks without anyone flagging why.
The fleet wanted one place that already knew which lanes and trucks were actually profitable, which loads needed attention today, and which drivers or vehicles were about to become a compliance problem, without someone having to go looking for any of it.
What we set out to do
Five goals we agreed before writing code
- Turn load, cost and revenue data into a lane-by-lane and truck-by-truck profitability picture
- Flag at-risk loads and recommend an action, not just a status
- Pull structured data out of freight documents automatically, and flag what could not be read
- Track driver and vehicle compliance against expiry dates before they become violations
- Let anyone ask a plain question about the fleet and get a real answer from the data
How we approached it
Profit, risk and compliance, in the same view
Start from the numbers that actually define profit
Revenue alone hides a losing lane. We built the dashboard around margin, fuel cost and empty miles together, because those three numbers are what actually separate a profitable lane from one that only looks busy.
Turn flagged problems into a recommendation, not just a number
A dashboard that shows a truck is underutilised is useful. One that says which driver, which loads, and what to check next is what dispatch can act on the same day. We wrote the insight layer to always name the next step.
Treat documents as structured data waiting to be freed
A rate confirmation or proof of delivery already contains every field a dashboard needs. We built extraction that reads the document once and pushes the result everywhere it is needed, rather than having someone retype it three times.
Make compliance a weekly to-do list, not an audit surprise
Licence, medical, insurance and inspection dates are all known in advance. We built the compliance view to surface what expires soon, every week, instead of waiting to discover a lapse during an inspection.
What we built
One command centre over profit, risk and compliance
A profitability dashboard across lanes, trucks and customers
Revenue, margin, fuel cost and empty miles roll up by lane, by truck and driver, and by customer, so the fleet can see at a glance which lanes are worth running and which customers are actually worth keeping.
Written AI insights, not just charts
The dashboard surfaces plain-language findings such as a lane with high revenue but thin margin after fuel and empty miles, or a truck running well below the fleet's average utilisation, each with a suggested next step.
A live dispatch board with risk flags
Active loads are scored by risk, with the reason attached. A load running toward a border delay gets a reroute suggestion and a customer-notification reminder; a completed load with no proof of delivery is flagged because it is blocking its own invoice.
Document extraction with a confidence score
Rate confirmations, bills of lading, proofs of delivery and invoices are read automatically, with a confidence score on the extraction and an explicit list of any field it could not find, so nothing silently goes missing.
A compliance tracker for drivers and vehicles
Licence, medical, insurance, training and inspection status are tracked per driver and per truck against expiry dates, rolled up into a single weekly summary of what needs attention and by when.
A natural-language assistant over the fleet's own data
A simple chat interface answers direct questions, such as which lanes are losing money or which drivers have a compliance issue, by querying the same data behind the dashboard.
Design decisions
The choices that made it work
Margin and empty miles, not just revenue
Revenue alone makes every lane look worth running. Pairing it with margin and empty miles is what actually tells the fleet which lanes to grow and which to drop.
An insight is not finished without a next step
We treated what to do about a finding as part of the insight itself, not a separate judgement call left to whoever reads the dashboard.
Extraction confidence shown, not hidden
An extraction that is wrong and silent is worse than one that is flagged as uncertain. Every extracted document shows its confidence and lists exactly which fields could not be read.
Compliance as a forward-looking list, not a backward-looking record
Sorting by what expires soonest, rather than listing every record flatly, turns the compliance tracker into something a safety manager actually works from every week.
Under the hood
How it is built
- Next.js and React with TypeScript
- A document extraction pipeline with confidence scoring and missing-field detection
- A rules engine for risk flags on live loads, covering delay, border risk and missing proof of delivery
- A compliance data model tracking expiry dates for licences, medical, insurance and inspections
- A natural-language query layer over the same underlying fleet data the dashboard uses
The result
What changed for the business
- Lane and truck profitability visible at a glance, not reconstructed after the fact
- At-risk loads come with a recommended action, not just a flag
- Documents are read once and pushed everywhere the data is needed
- Compliance risks surface weeks before they become violations
- Anyone can ask a direct question about the fleet and get an answer from the real data
What comes next
Where this goes next
- Automatic customer notifications generated directly from a flagged delay
- Predictive maintenance scheduling from truck utilisation and inspection history
- A mobile driver app for direct document capture at pickup and delivery